Brazilian
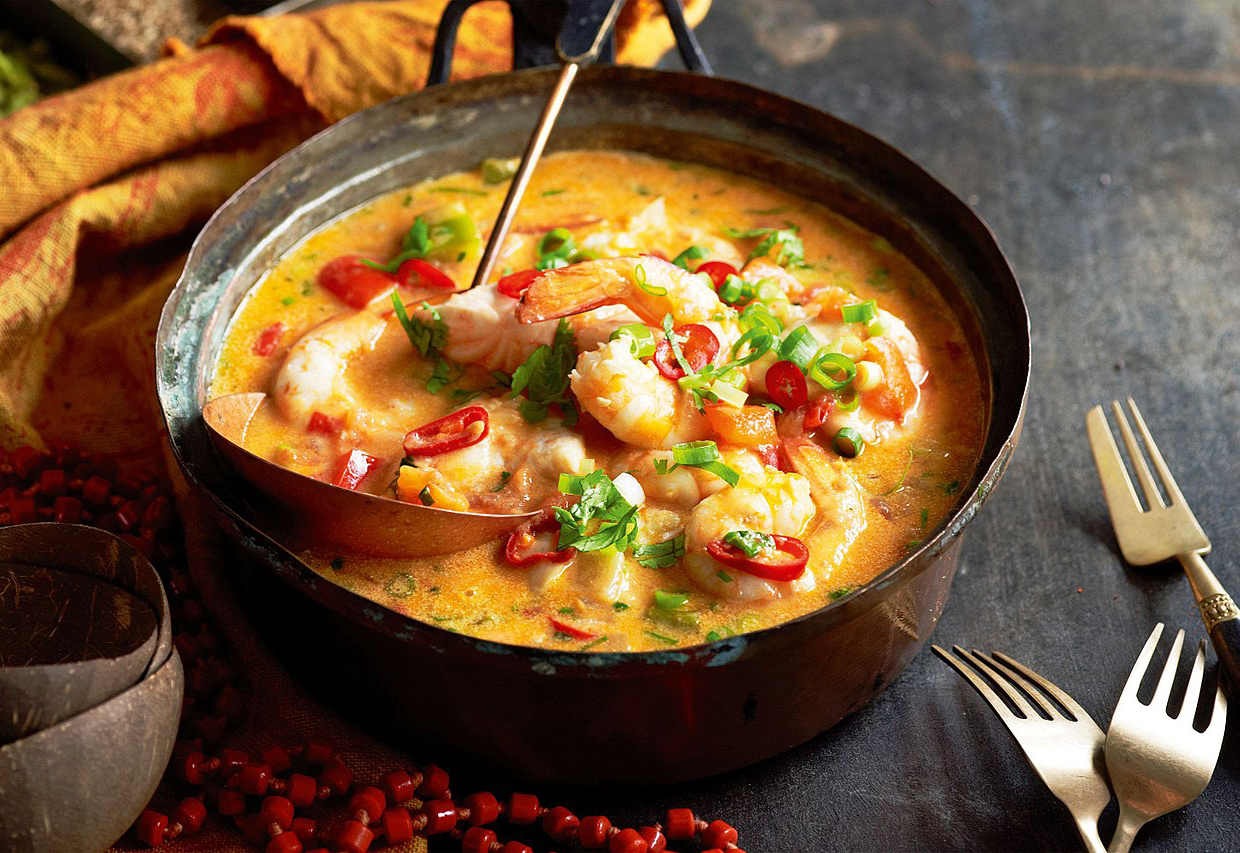
This cuisine includes popular stews such as feijoada (bean) and moqueca (seafood).
Food and cooking are defining centerpieces of many cultures. We may broadly think of pasta as Italian and noodles as East Asian, but what does it really mean for a dish to be labeled as a country or region's cuisine? What makes cuisines similar or different from each other? If these questions tickle you, we invite you to join us on this interactive exploration of recipes.
Scroll down to get started!
Cuisines are often characterized by the ingredients they use. We're exploring Yummly's dataset that contains 39,774 recipes from 20 different cuisines spanning 5 continents. Hover over the map to explore which countries these are and how many recipes each country has in our dataset. Russia is in both Europe and Asia, but we color coded it as Europe since its capital, Moscow, is located there.
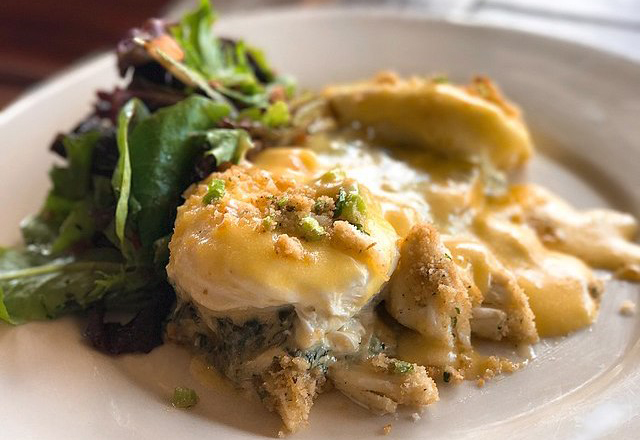
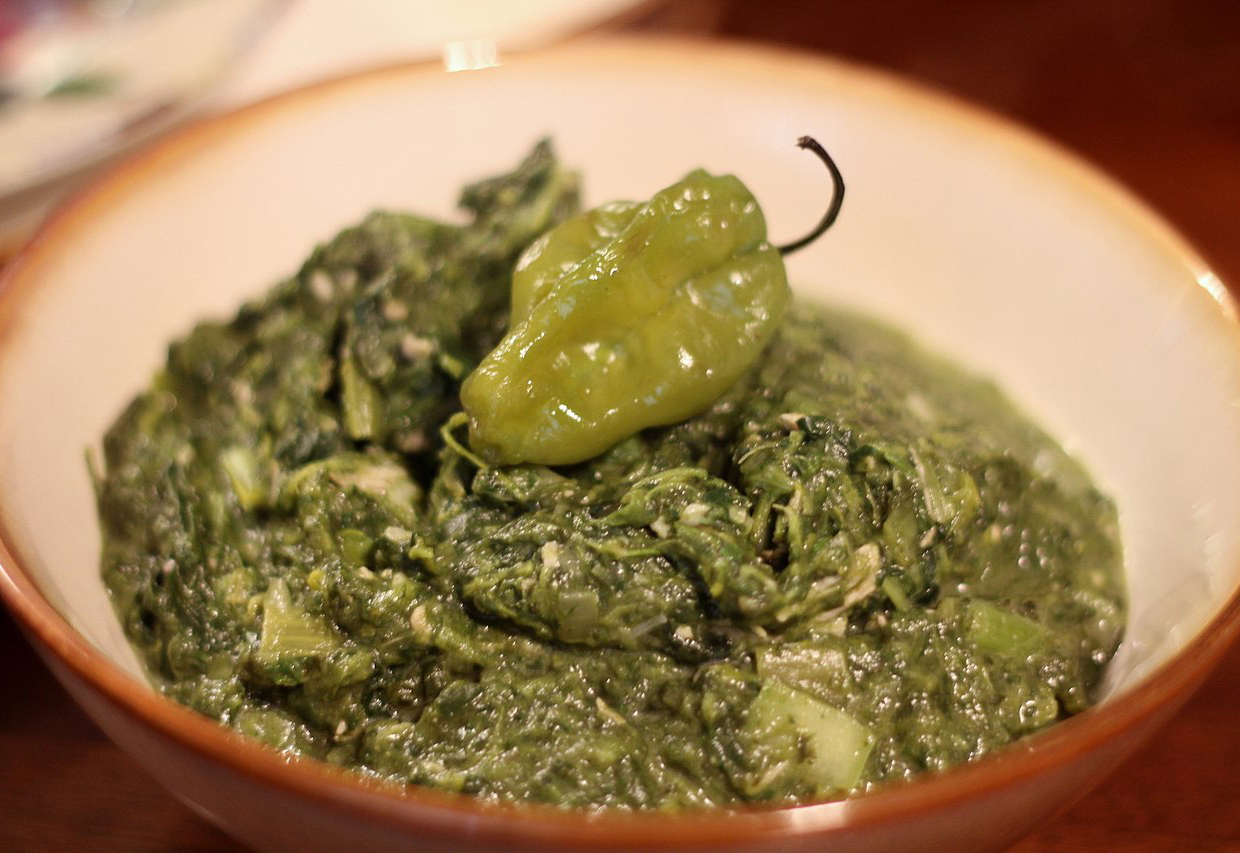
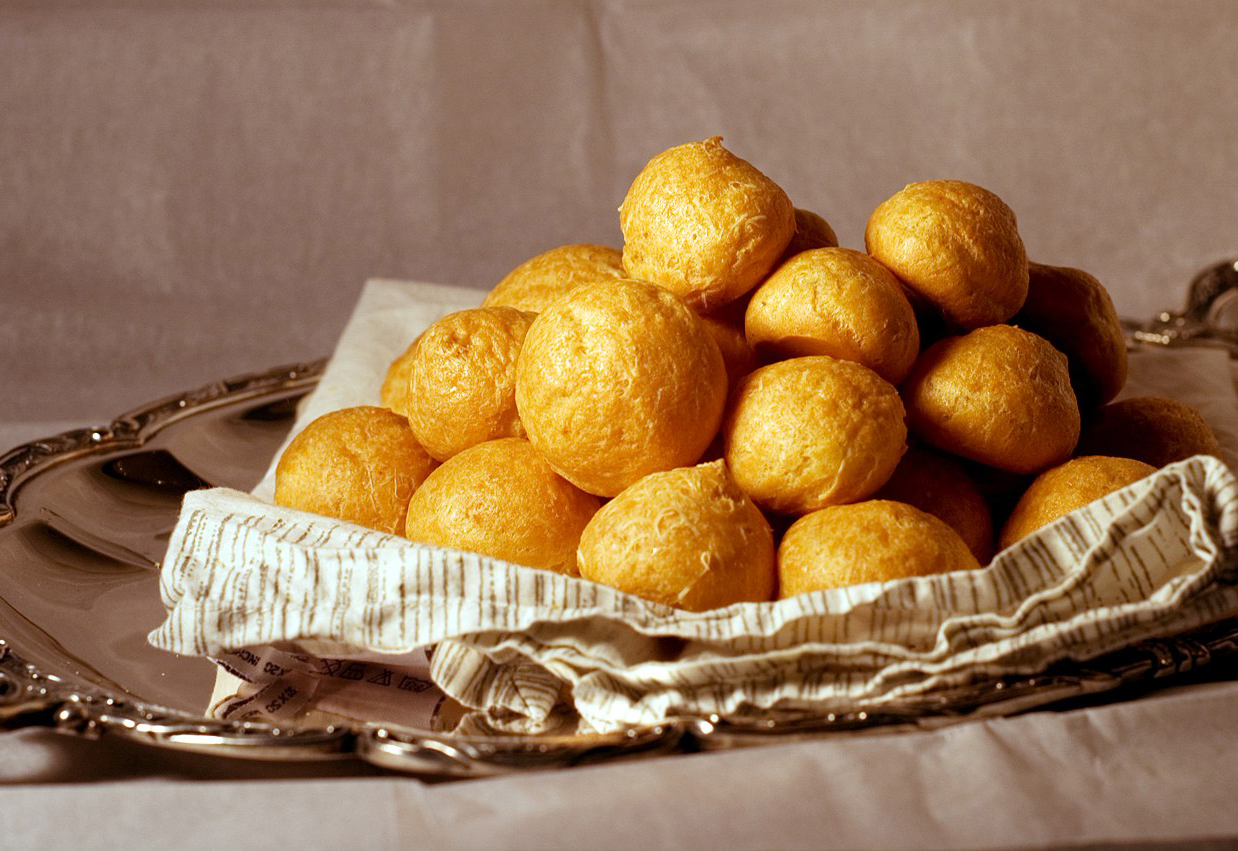
Often, cuisines close to each other geographically share common ingredients and dishes, but historical connections such as immigration, colonialism, and trade have led to additional waves of influence. Hover over each picture of a dish to see the cuisine it is from. Click on the picture to read more about the history of each cuisine and representative dishes from the cuisine's Wikipedia page.
The page for Cajun & Creole leads to the page for Lousiana Creole cuisine, so click here if you want to learn about Cajun cuisine.
This cuisine includes popular stews such as feijoada (bean) and moqueca (seafood).
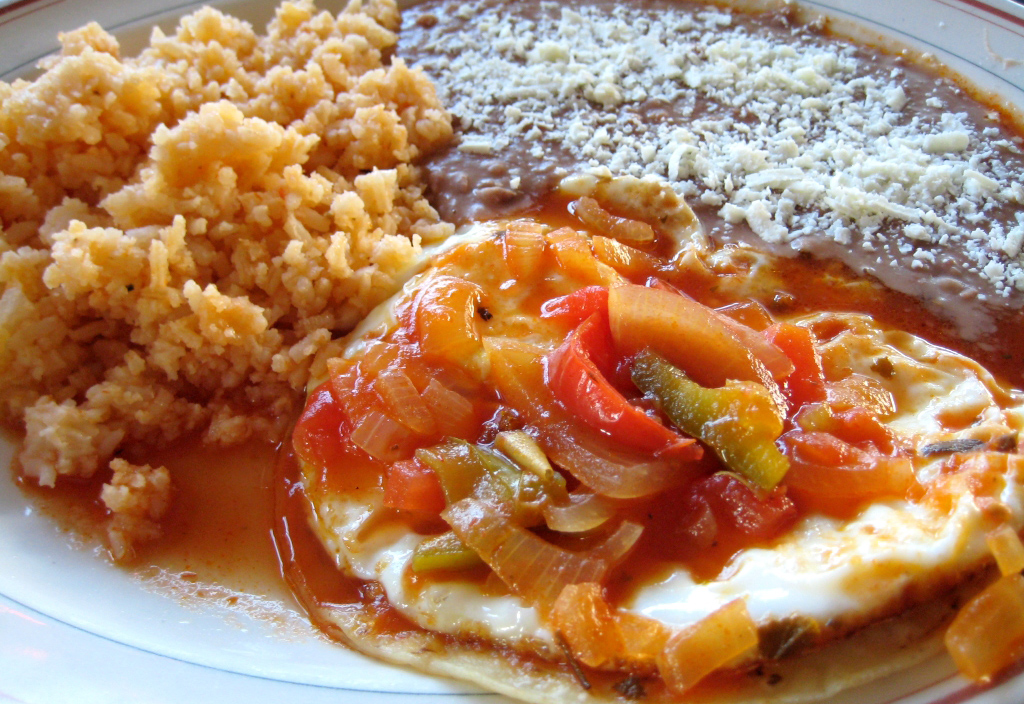
Common dishes include tacos, tortas, chile rellanos, and mole sauce.
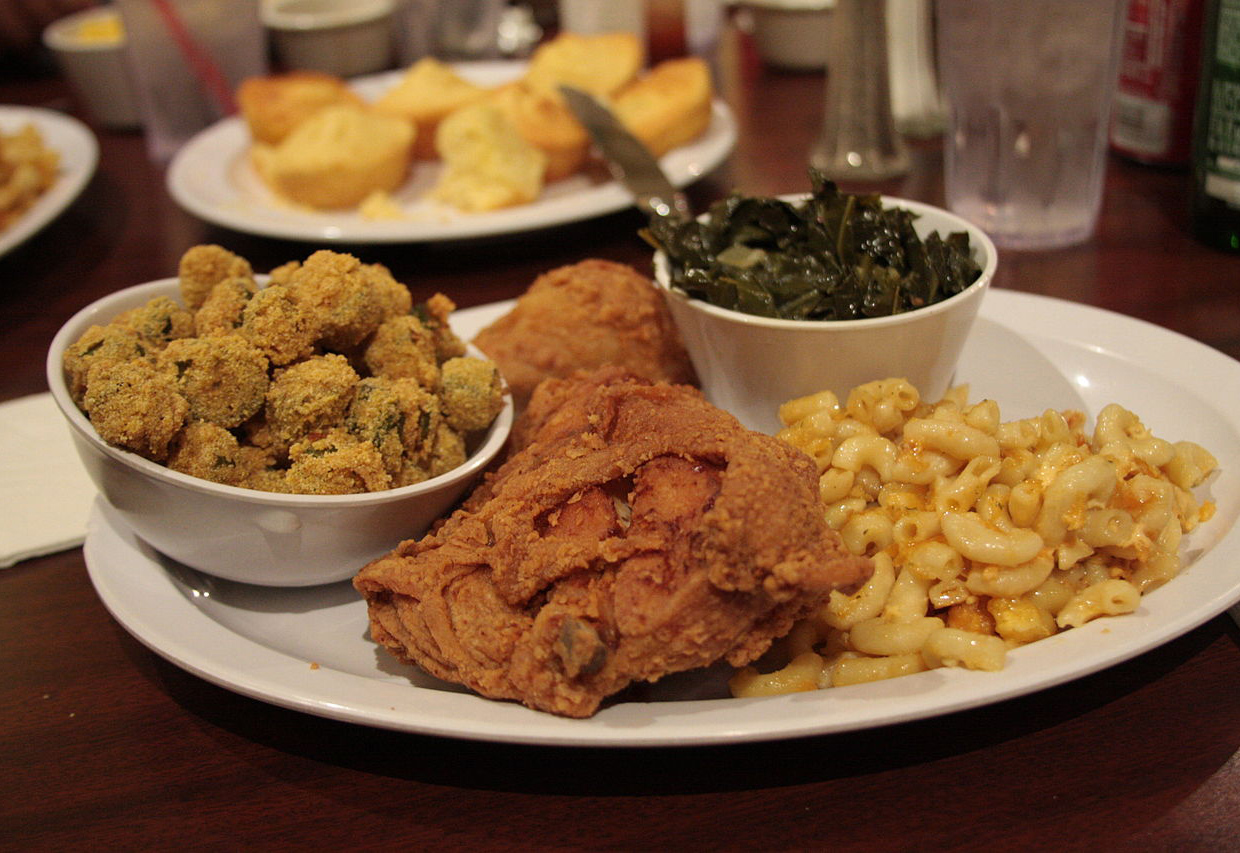
Representative dishes include grits, buttermilk biscuits, and fried chicken.
Cajun and Croele are not actually the same, and feature different dishes, but both occur in Louisiana.
Ackee and saltfish, coconut shrimp, jerk chicken, and ital stew are popular dishes.
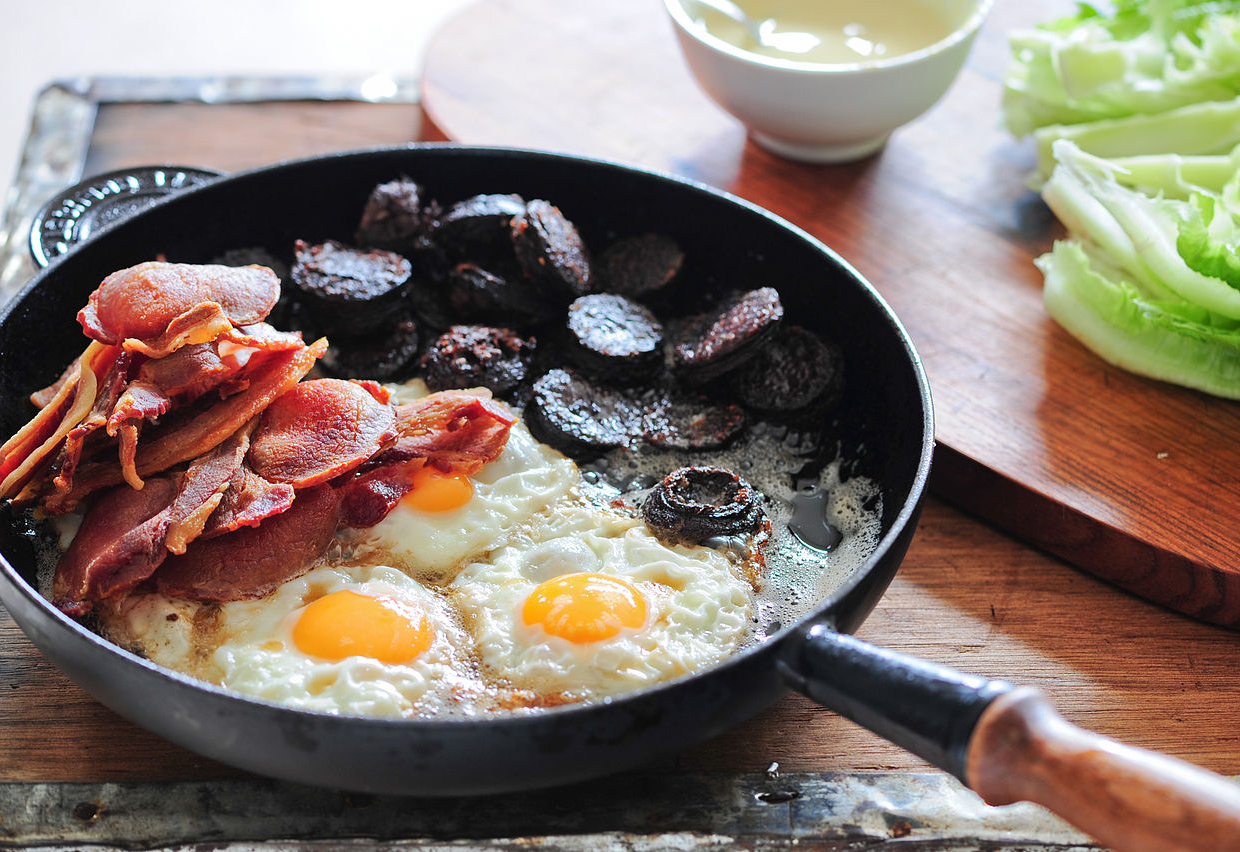
Common dishes include Irish stew, bacon and cabbage, and black pudding.
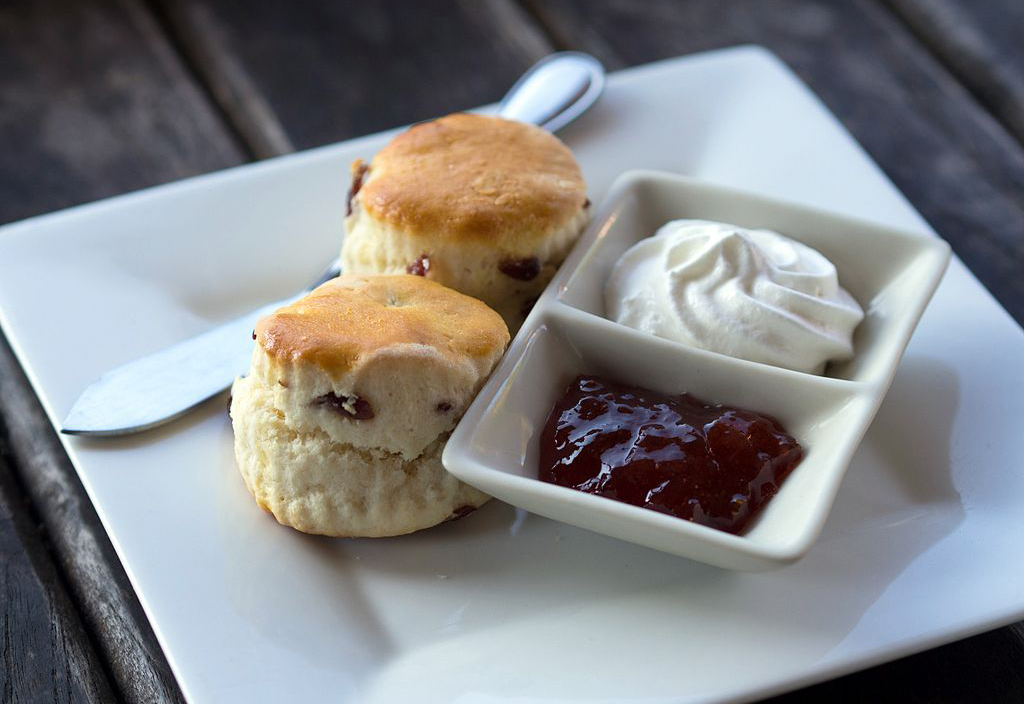
Traditional dishes include fish and chips, shepherd's pie, and beef Wellington.
A variety of cheeses and wines are central to this cuisine, and their patisserie is world-renowned.
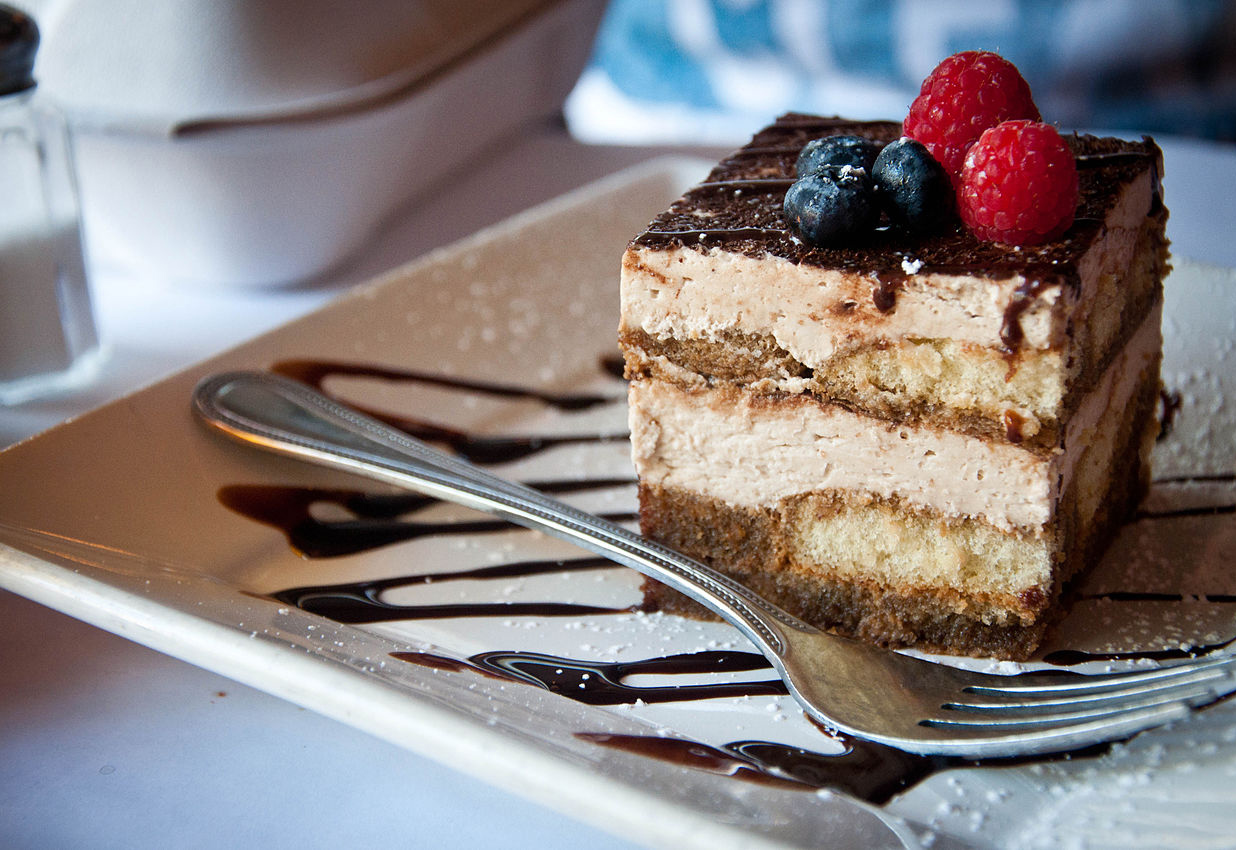
Different regions of Italy feature their own specialty breads, pizzas, and pastas.
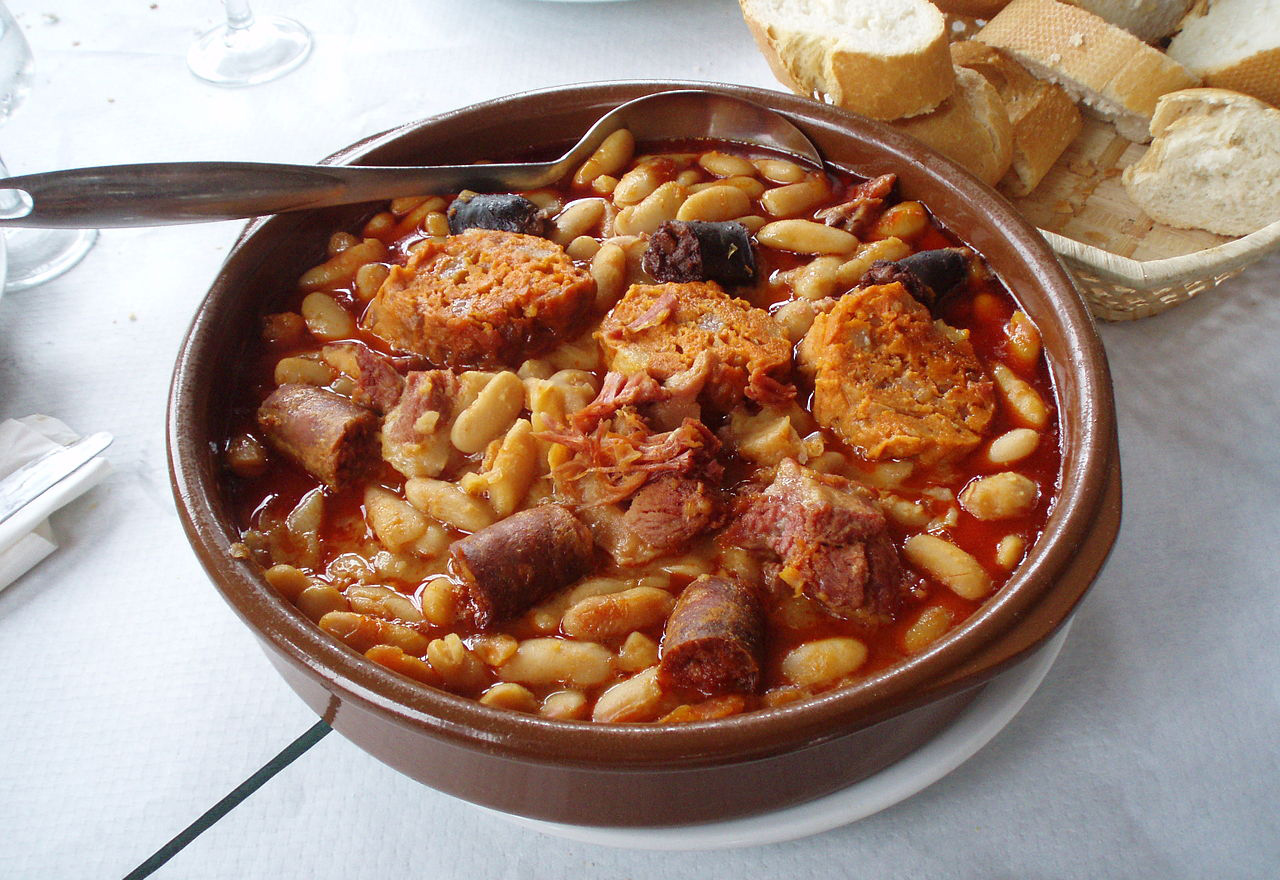
Staple dishes include croquettes, paella (rice), and gazpacho (soup).
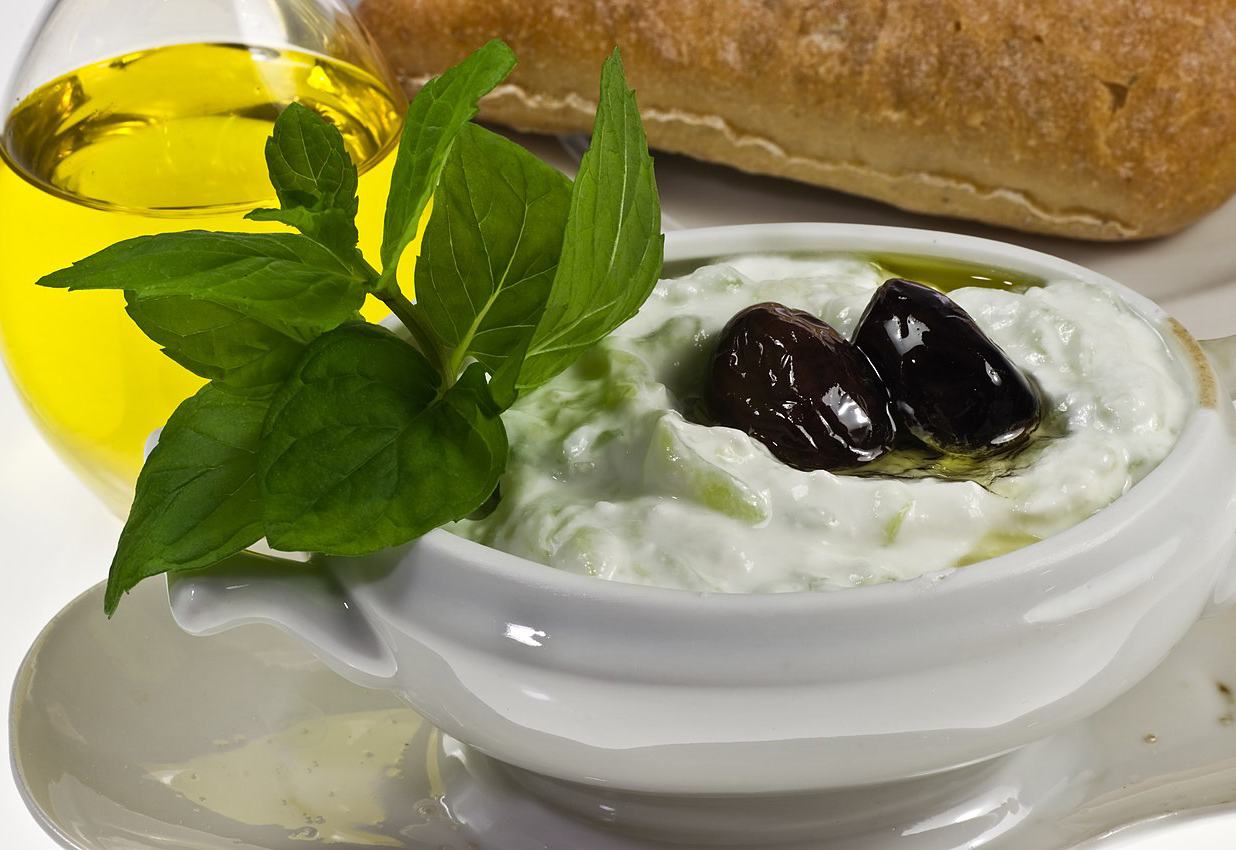
Common dishes include tzatziki (yogurt dip) and pies wrapped in filo pastry.
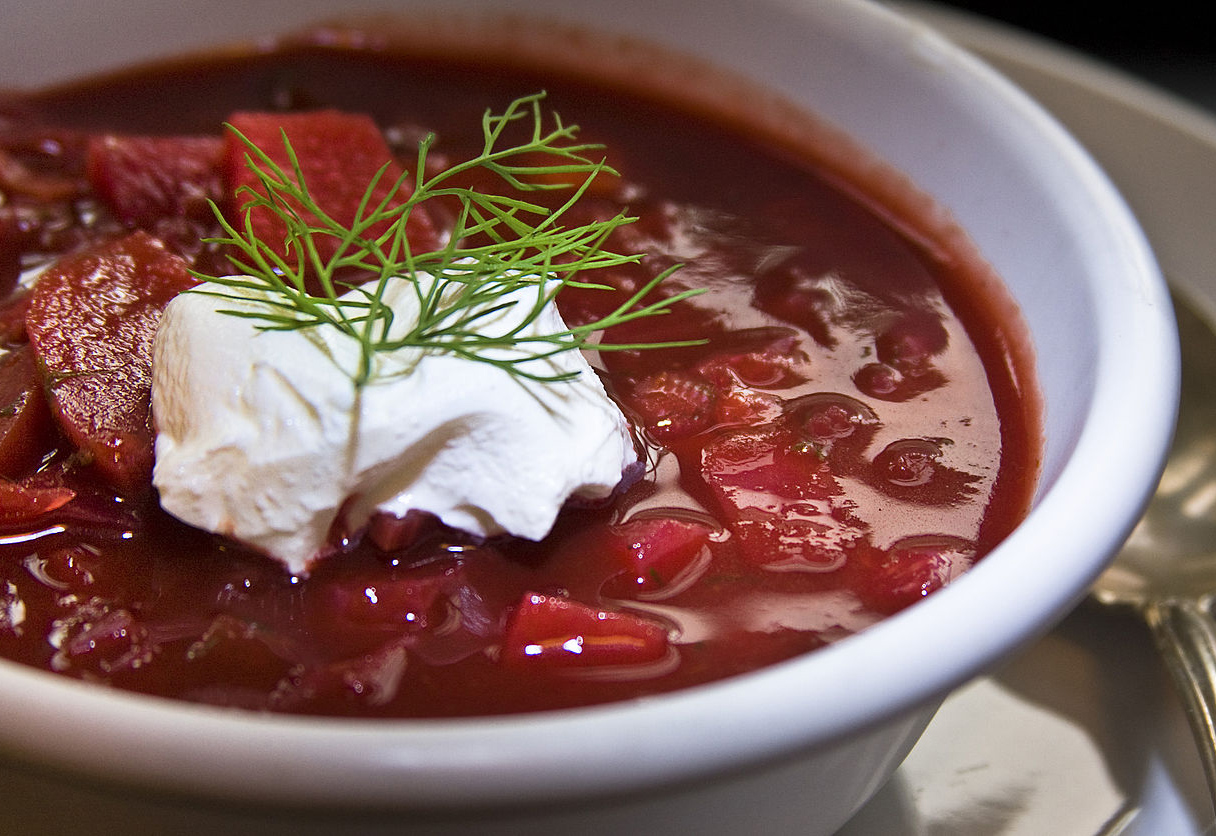
This cuisine includes a variety of soups including borscht (beet soup) and pelmeni (dumplings).
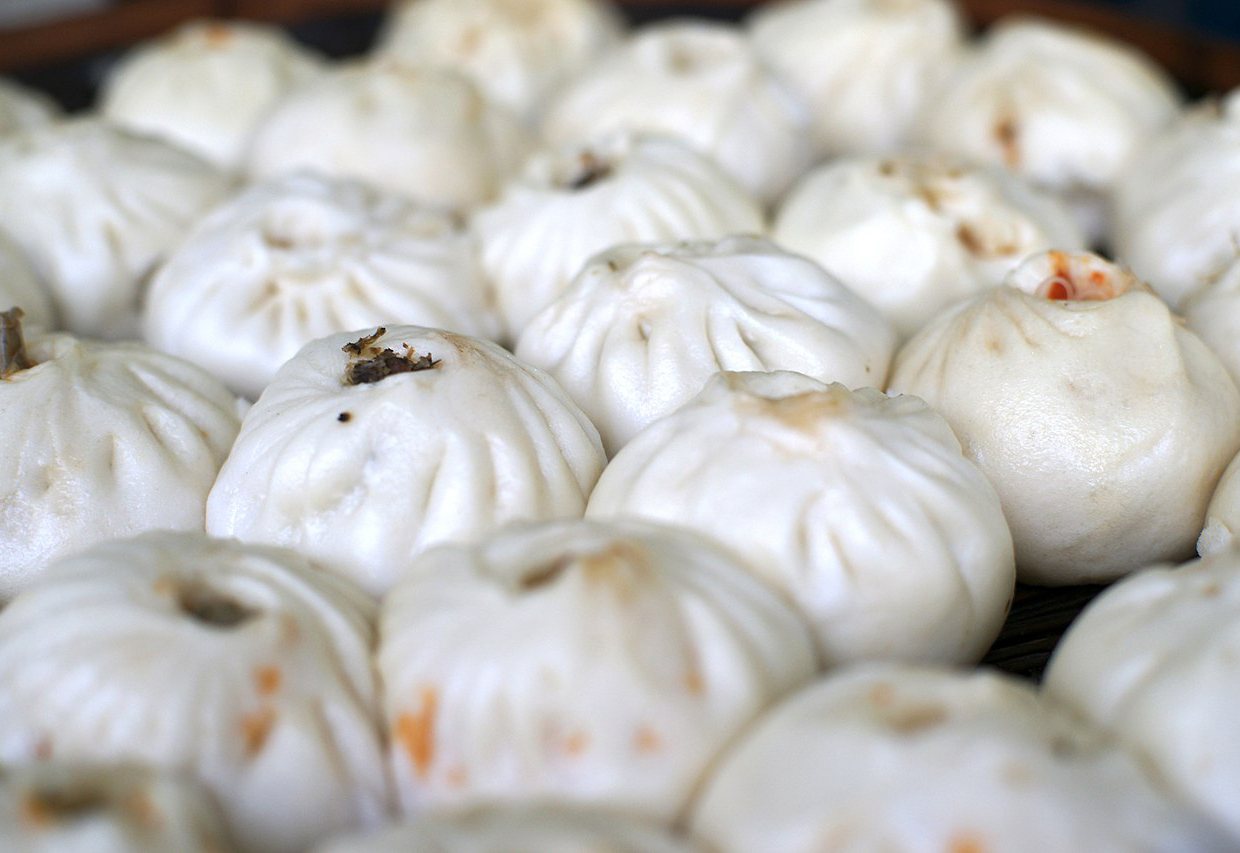
This cuisine features dishes such as dumplings, steamed buns, noodles, and rice.
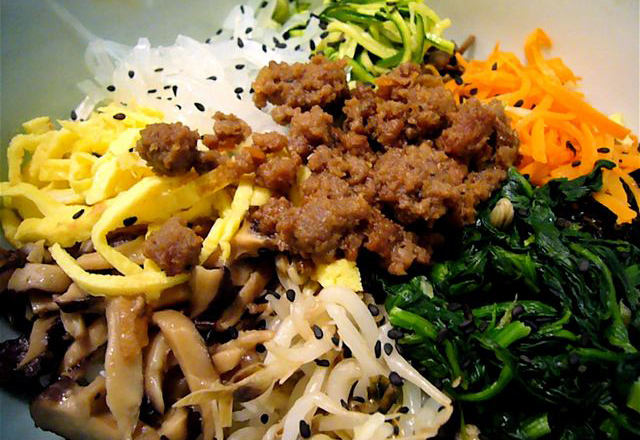
Soft tofu soup and bibimbap are often accompanied by a variety of banchan (side dishes).
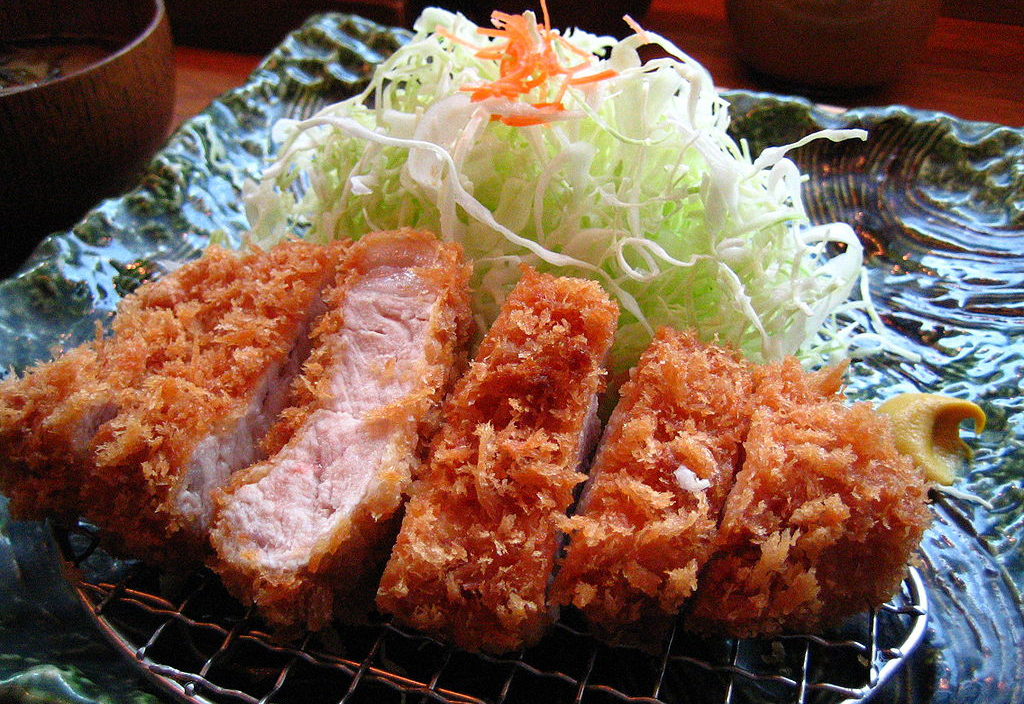
Staple foods include rice, noodles, and grilled or raw seafood.
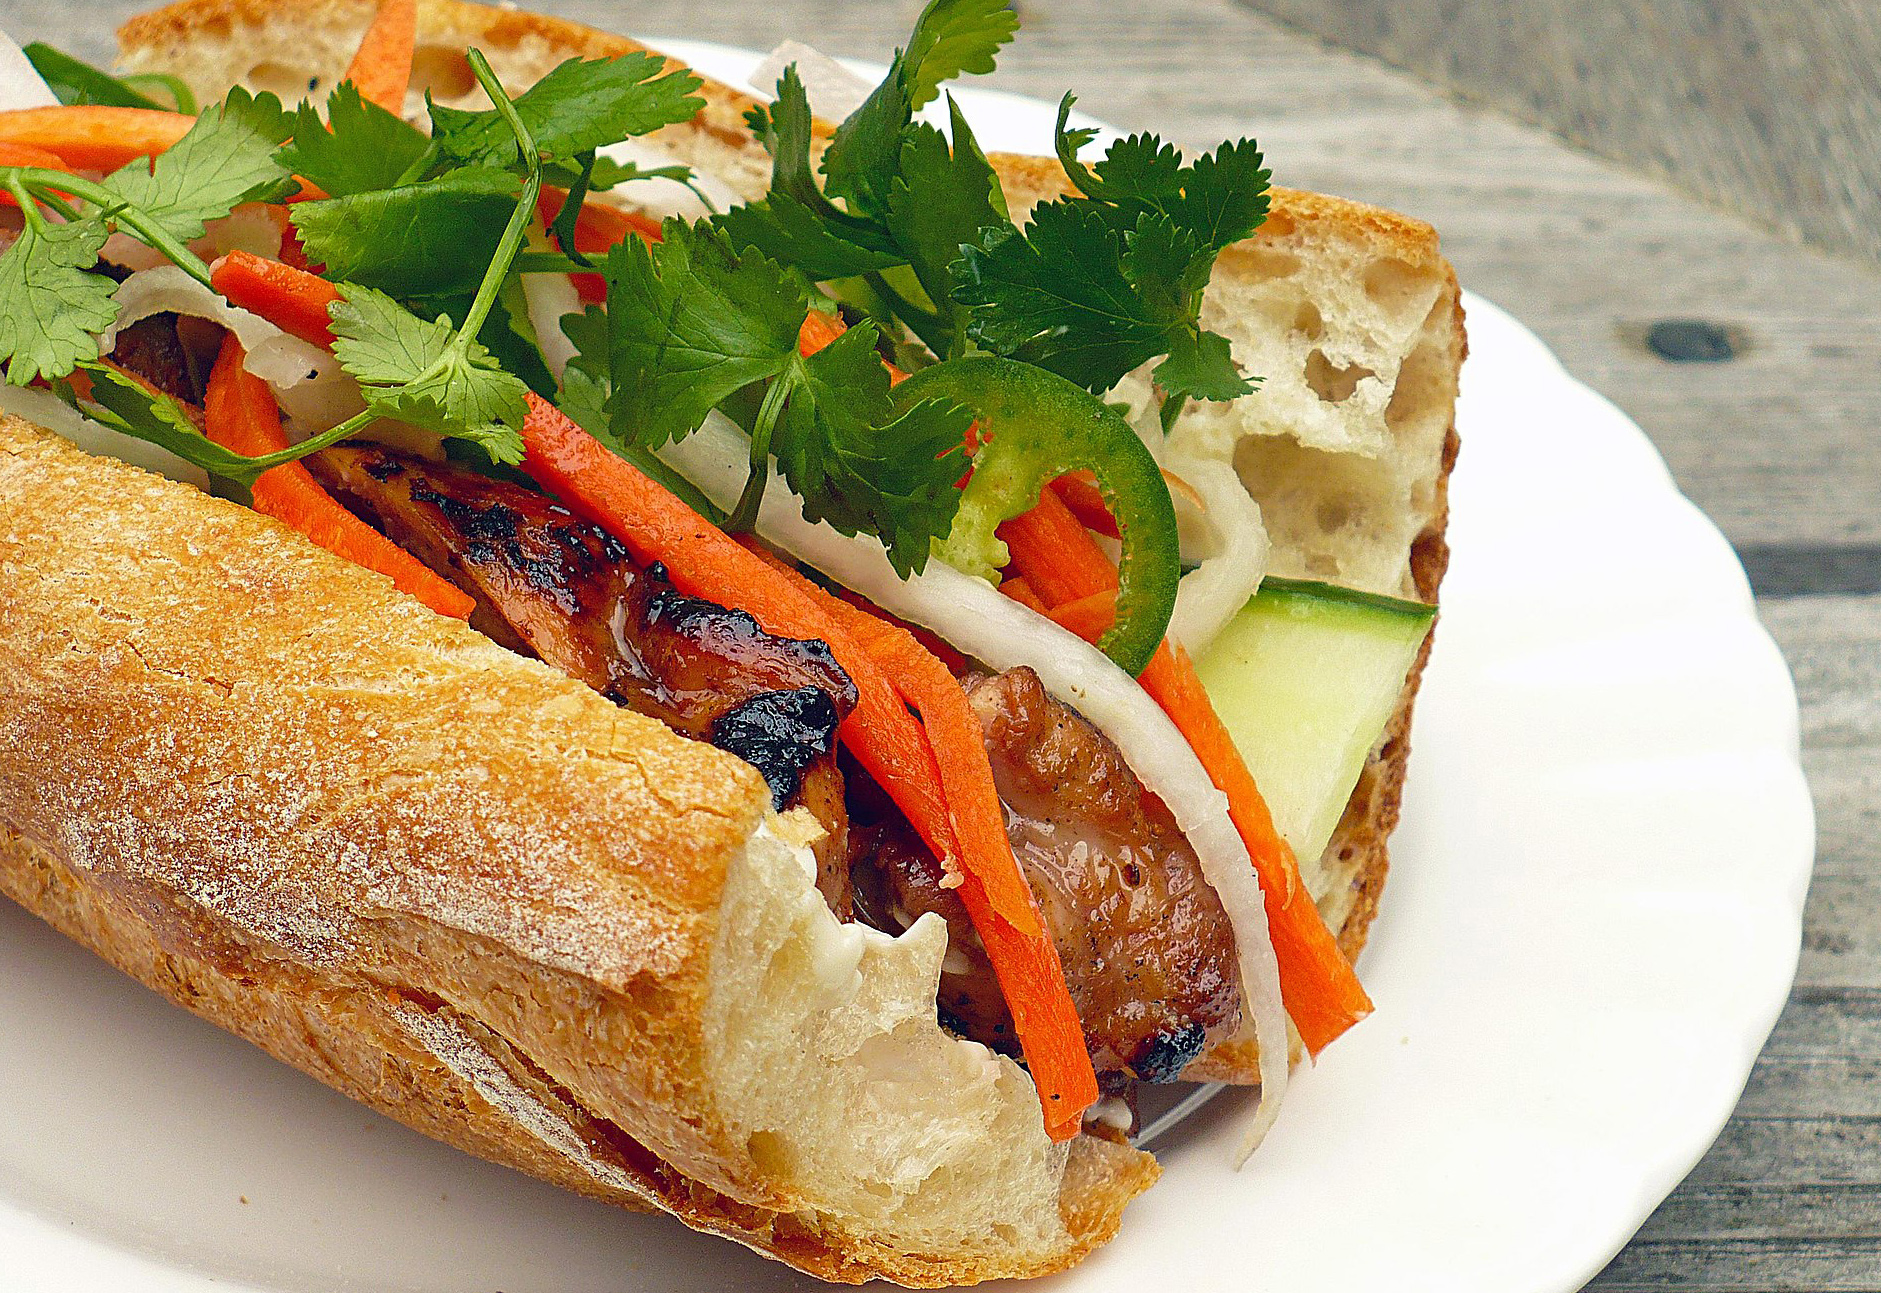
Full of fresh ingredients and rice-based ingredients, this cuisine includes pho and bánh mì.
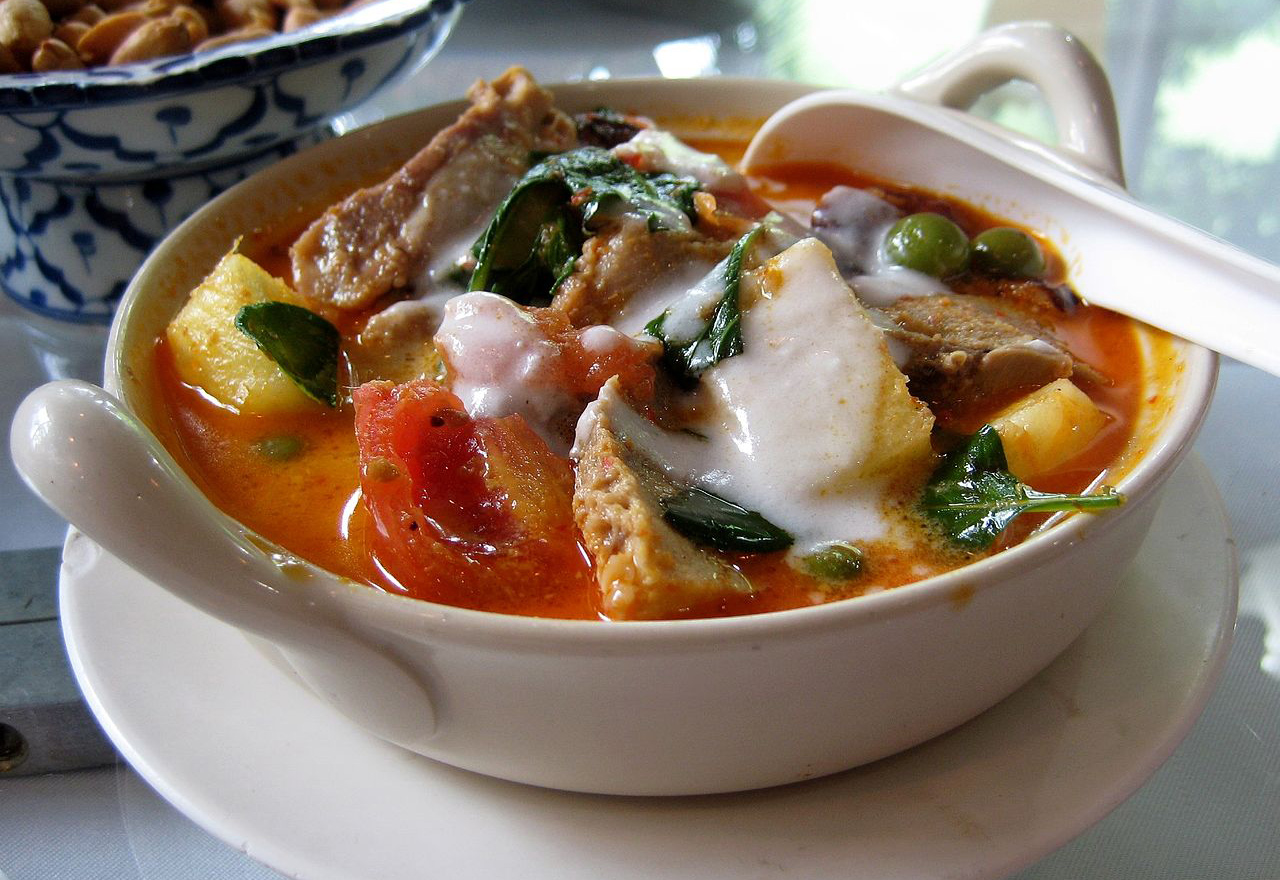
There are four main categories of dishes: tom (boiled), yam (salads), tam (pounded), and gaeng (curries).

Popular dishes include adobo, pancit (noodles), and lumpia (spring rolls).
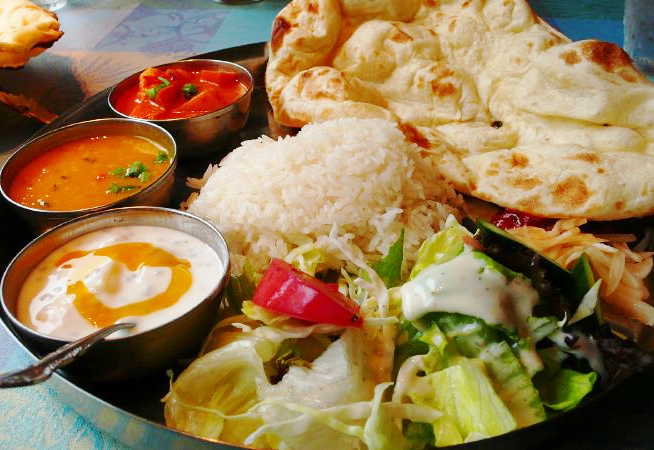
The word "curry" actually covers a wide variety of dishes prepared with sauce.
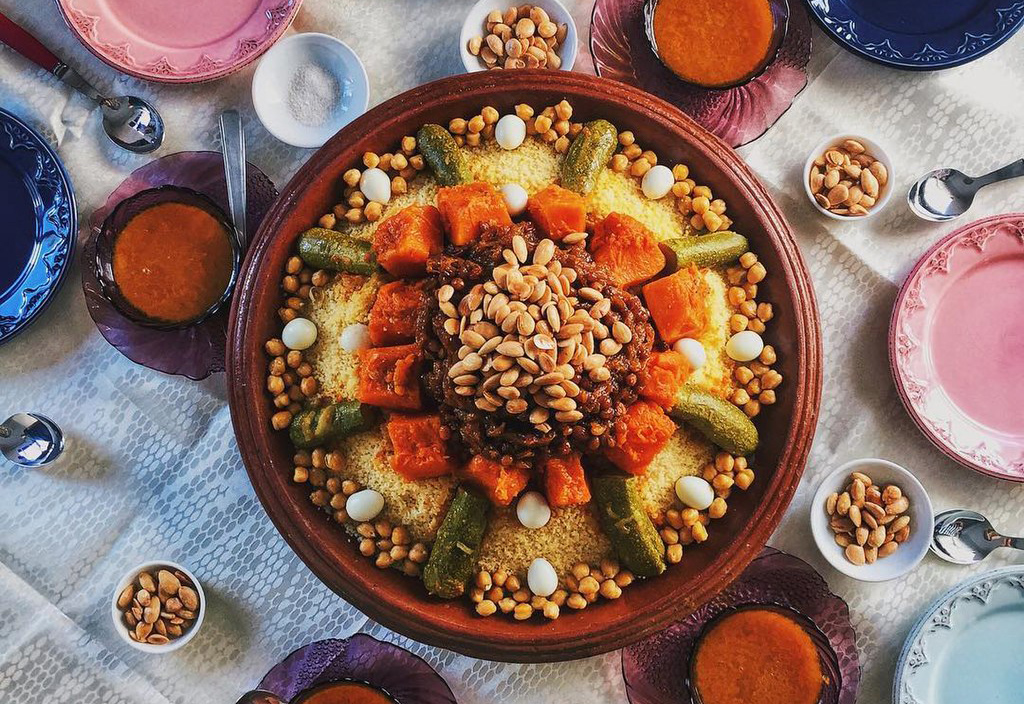
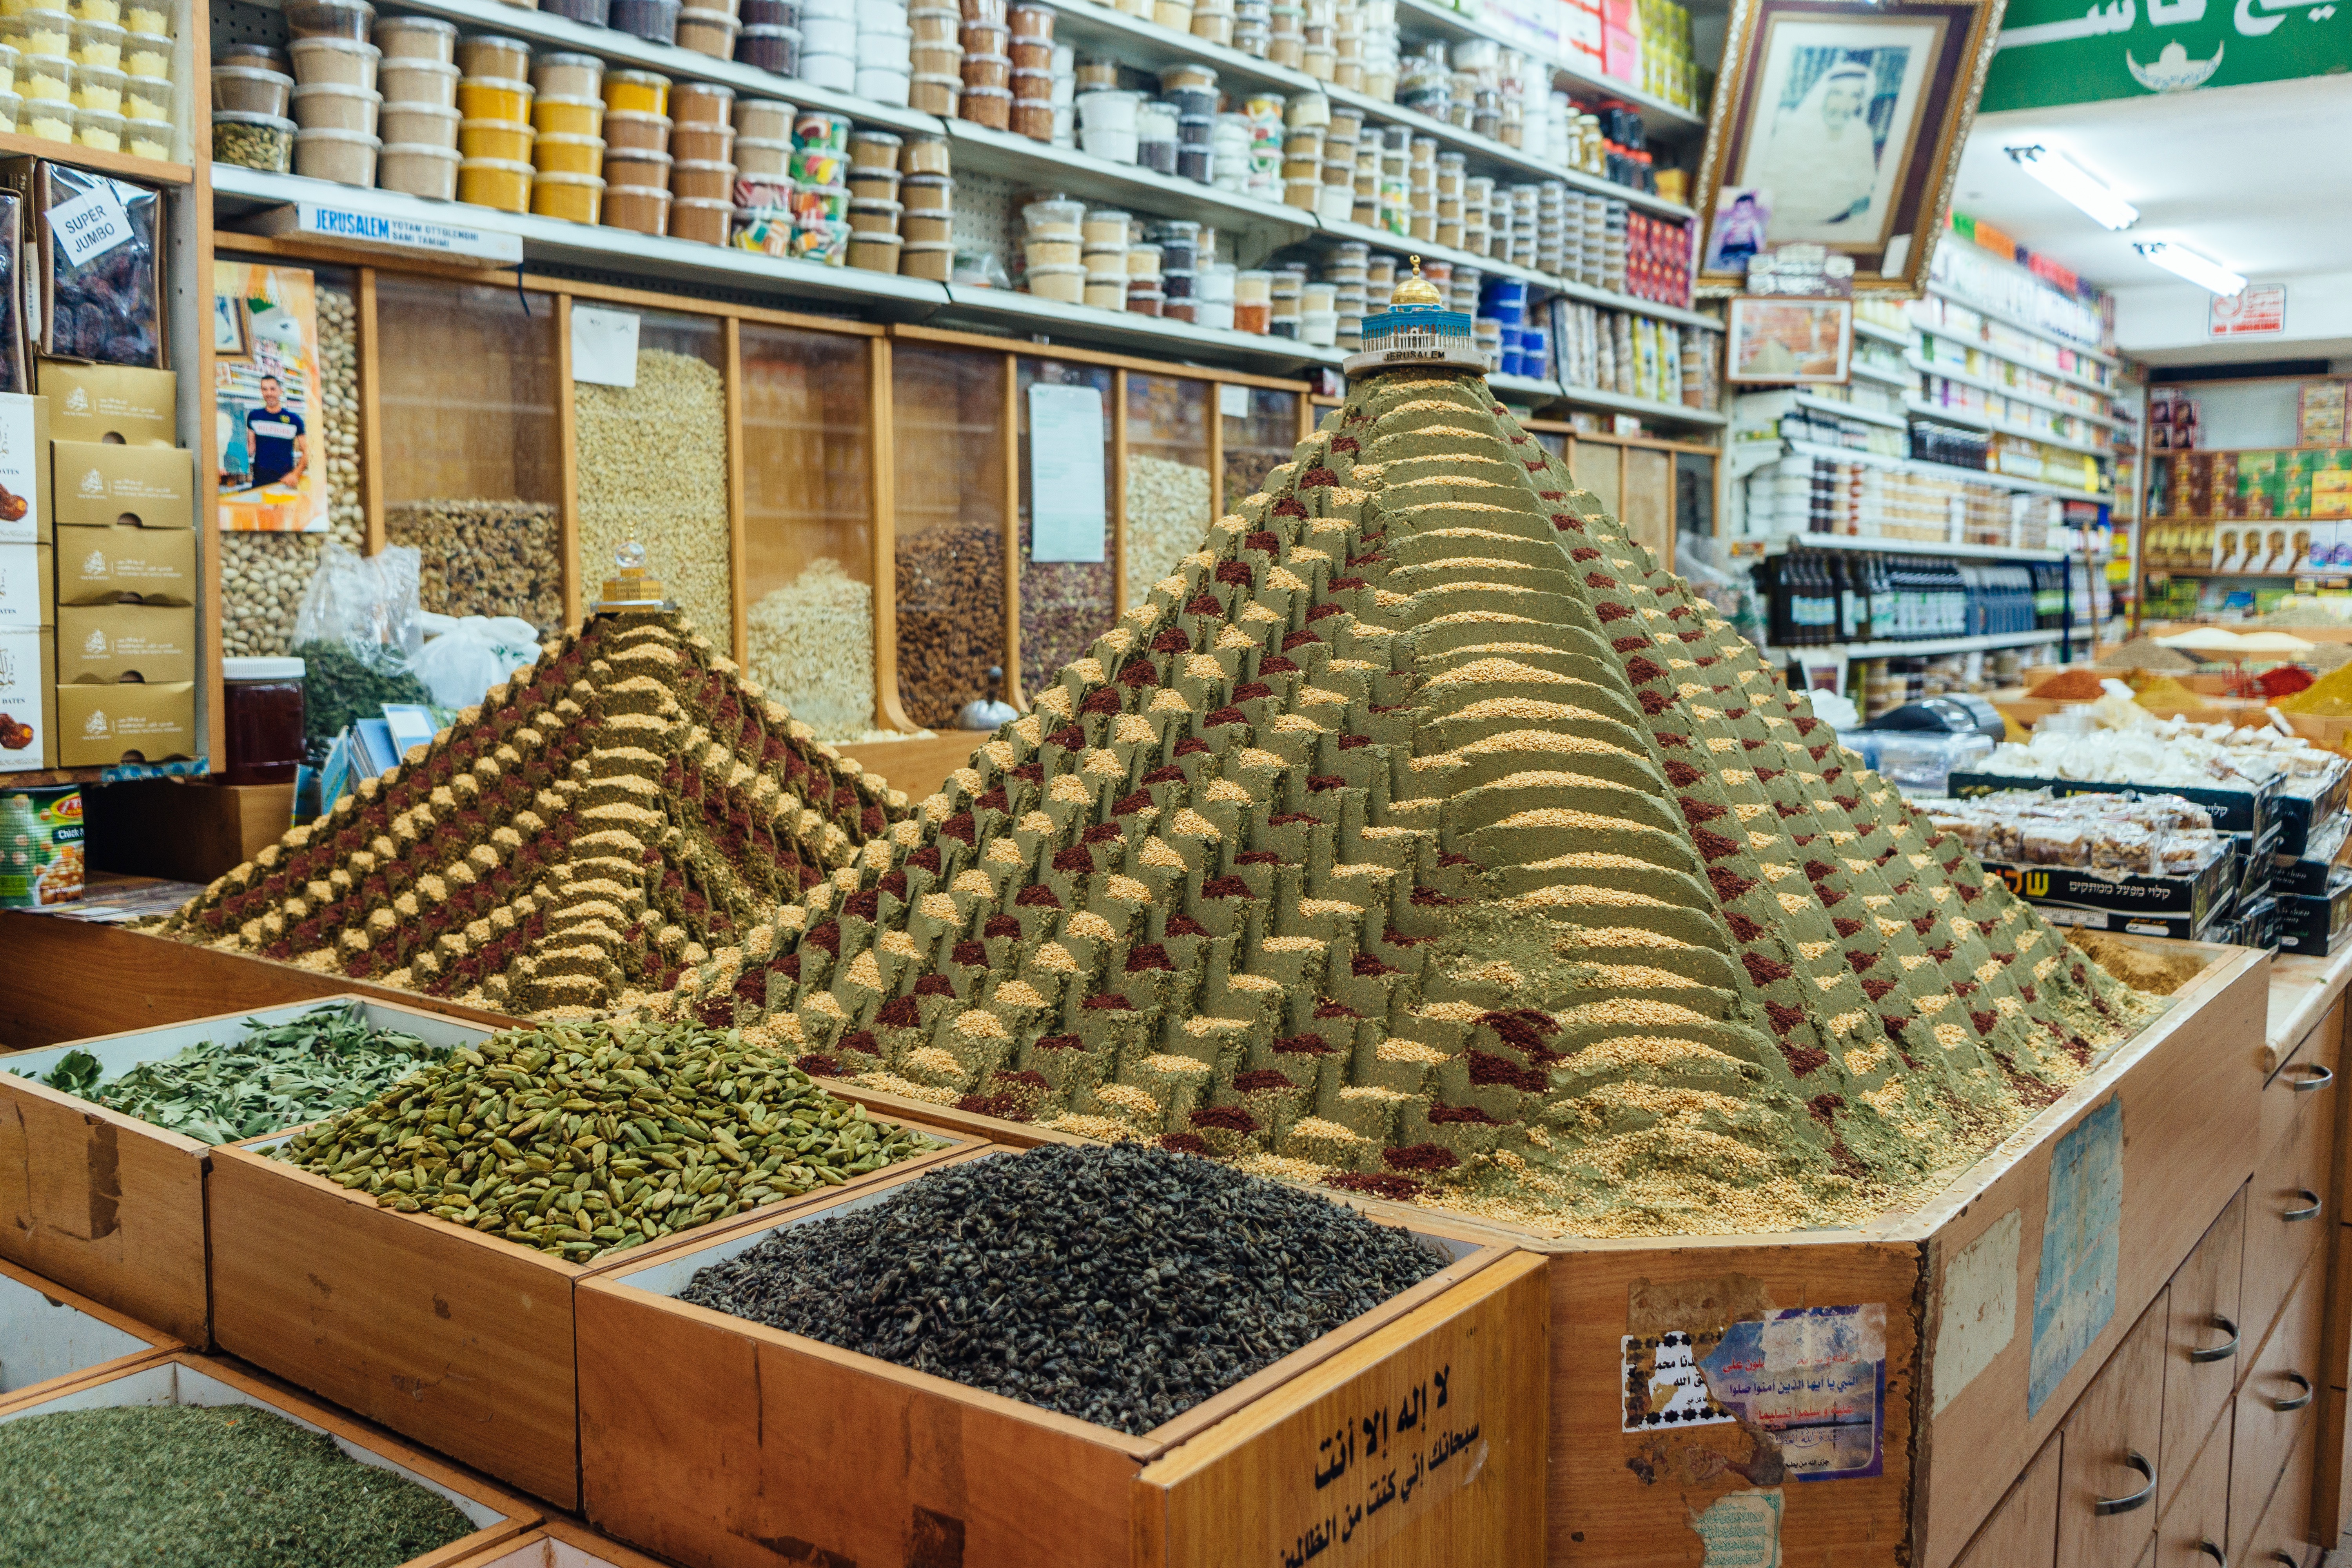
Common dishes include couscous, pastilla (meat pie), and tajine (stew) with lots of spices.
First, we'll take a look at what ingredients tend to be most popular in each cuisine. Below, you'll see a series of bar charts showing the top 10 ingredients in each cuisine and their frequencies, with cuisines colored and grouped by continent.
Hover over bars to see which popular ingredients are shared across cuisines. Which cuisines tend to use a lot of butter? Which cuisines use a lot of soy sauce? Are any foundational ingredients uniquely popular to only one cuisine?
From these charts, we get some sense that some cuisines may share many ingredients, while some do not. Are cuisines within the same continent more similar to each other than cuisines across continents? Maybe there is a better way to see if this is the case...
We want to know how cuisines compare to each other. However, there are over 65 thousand unique ingredients in our dataset, and we can't just go through each and every one and eyeball if it's shared or not between two cuisines. That would take forever!
Instead, we take the long list of ingredients for each cuisine and do some computational magic to squash it down ...
Jamaican: 332 salt, 173 onions, 153 water, 139 garlic, 128 ground allspice, 125 pepper, 111 scallions, 105 dried thyme, 103 black pepper, 101 garlic cloves, 96 vegetable oil, 89 ground black pepper, 80 sugar, 75 ground cinnamon, 72 thyme, 72 brown sugar, 71 coconut milk, 67 soy sauce, 66 olive oil, 66 curry powder ...
↓
Jamaican: 0.83, 0.04.
... all the way to just two numbers (which we'll call "Cuisine Dimension 1" and "Cuisine Dimension 2"), so we can look at how much cuisines relate to each other on a 2D chart. In the scatter plot below, cuisines are located based on the values of these two numbers. Cuisines that are closer to each other are more similar.
Hover over each cuisine's point to view more information about where it is from and some of its notable ingredients. A notable ingredient is one that is often used in one cuisine but not in any other cuisine. These are extracted using a calculation similar to what was in done in Flowing Data's visualization.
Do you notice any interesting outliers, or similarities that surprised you?
Let's zoom in even further on the ingredients used in these cuisines. We know that some classic pairs of flavors go very well together, like tomato and basil. What are other common pairings of ingredients? Are pairings divided based on regional cuisine differences?
We create a network of popular ingredients, drawing edges between the most significantly co-occurring pairs. Nodes are colored by continent, if at least 75% of their recipes are in that continent. Gray nodes are ingredients that are used across continents.
Food for thought: what regions of the network seem to correspond to Asian cuisines? Can you find the community of nodes that corresponds to dessert ingredients?
You can zoom for a closer look, hover over nodes to see their neighbors, click on nodes to lock in the view of their and their neighbors' labels, and click again to release.
We hope you enjoyed these visualizations and learned about how cuisines from different areas of the world relate to each other.
This was a class project by two Berkeley students. You can see the code we wrote to generate these visualizations and the resources we used to learn d3 here.
Note that this website is best viewed using Google Chrome and on a computer instead of mobile.
The first image is our own. Images in the cuisine gallery are pulled from their Wikipedia pages, or the Wikipedia pages that list dishes from each cuisine.